Statistics - Test Papers
CBSE Test Paper 01
CH-14 Statistics
- Which of the following variables are discrete ? 1. Size of shoes, 2. Number of pages in a book, 3. Distance travelled by a train, 4. Time
- 2 and 4
- 1 and 3
- 1 and 4
- 1 and 2
- ‘Less than’ cumulative frequency table for a given data is as follows. Then, the frequency of class interval 20-30 is
Marks Less than 10 Less than 20 Less than 300 Less than 40 Cumulative frequency 3 17 37 92 - 34
- 55
- 14
- 20
- Find out the mode of the following: 5, 4, 3, 5, 6, 6, 6, 5, 4, 5, 5, 3, 2, 1
- 4
- 5
- 6
- 3
- In the given graph, the number of students who scored 60 or more marks is
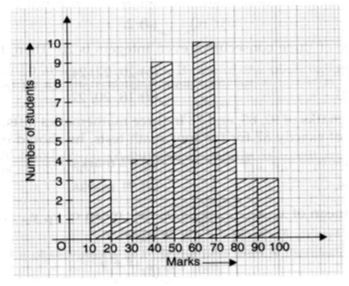
- 22
- 20
- 21
- 19
- In a bar graph if 1 cm represents 30 km, then the length of bar needed to represent 75 km is
- 3.5 cm
- 2.5 cm
- 2 cm
- 3 cm
- Fill in the blanks: The difference between the upper-class limit and lower class limit is called ________ .
- Fill in the blanks: The percentage of marks obtained by students of a class in mathematics are 65, 35, 37, 23, 0, 18, 82, 92, 72, 32, 10, 5. Then median is ________.
- Write the class mark of 90-110 group.
- Find the arithmetic mean of first 6 natural numbers.
- Find the median of the following observation : 72, 68, 42, 33, 35, 39, 40, 41, 65, 69
- The mean of 40 observations was 160. It was detected on rechecking that the value of 165 was wrongly copied as 125 for computation of mean. Find the correct mean.
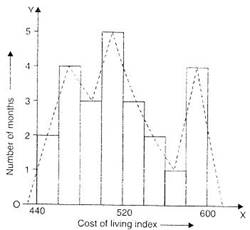
- Draw a histogram and frequency polygon to represent the following data on the same scale) which shows the monthly cost of living index of a city in a period of 2 years :
Cost of living index
Number of months
440-460
2
460-480
4
480-500
3
500-520
5
520-540
3
540-560
2
560-580
1
580-600
4
Total
24
Find the missing value of p of the following distribution whose mean is 12.58.
x 5 8 10 12 p 20 25 f 2 5 8 22 7 4 2 The water bills (in Rs.) of 32 houses in a certain street for the period 1.1.98 to 31.3.98 are given below:
56, 43, 32, 38, 56, 24, 68, 85, 52, 47, 35, 58, 63, 74, 27, 84, 69, 35, 44, 75, 55, 30, 54, 65, 45, 67, 95, 72, 43, 65, 35, 59.
Tabulate the data and present the data as a cumulative frequency table using 70-79 as one of the class intervals.Find the missing frequencies in the following frequency distribution if it knows that the mean of the distribution is 50. The total frequency is 120.
x 10 30 50 70 90 f 17 f1 32 f2 19
CBSE Test Paper 01
CH-14 Statistics
Solution
- (d) 1 and 2
Explanation: Discrete variables are variables that can only take finite values.Size of shoes & pages in the book have finite number.
- (d) 20
Explanation: A cumulative frequency distribution is the sum of the class and all classes below it in a frequency distribution.Less than 30 has the class interval 20-30. Frequency of this class interval will be corresponding to
Marks Cumulative
frequencyClass Frequency Less than 10 3 1-10 3 Less than 20 17 10-20 14 Less than 30 37 20-30 20 Less than 40 92 30-40 55 37 - 17 = 20
- (b) 5
Explanation: The observation which occurs maximum number of times is called as mode of the given data.Above given data has maximum number of 5, so mode is 5
- (c) 21
Explanation: Add the values corresponding to the height of the bar from 60 to 10010 + 5 + 3 + 3 = 21
- (b) 2.5 cm
Explanation: 1 cm - 30 kmso for 75 km
class width/ class size
33.5
Class Mark =
Class Mark =
Class Mark =
Class Mark = 100
First six natural numbers are 1, 2, 3, 4, 5, 6. Let be their arithmetic mean. Then,
= = = = 3.5Arranging the data in ascending order, we have
33, 35, 39, 40, 41, 42, 65, 68, 69, 72
Number of items (N) = 10 which is even.
.Here, n = 40, = 160
So, = () 160 = () = 160 40 = 6400
Incorrect vlaue of = 6400
Now,
Correct value of = Incorrect value of - Incorrect item + Correct item
Correct value of = 6400 - 125+165 = 6440
Correct mean = = = 161Histogram and Frequency polygon representing the cost of living index of a city in a period of 2 years.
xi fi fixi 5 2 10 8 5 40 10 8 80 12 22 264 p 7 7p 20 4 80 25 2 50 N = 50 = 7p + 524 Given Mean = 12.58
= 12.58
= 12.58
7p + 524 = 629
7p = 629 - 524
7p = 105
p = = 15The minimum and maximum bills are Rs.24 and Rs.95.
The range is 95 - 24 = 71
Given class interval is 70 - 79. So, class size is 79 - 70 = 9
Number of classes = = = 7.80
Number of classes = 8
The cumulative frequency distribution is as:Bills (Rs.) No. of house (Frequency) Cumulative frequency 16-25 1 1 25-34 3 4 34-43 5 9 43-52 4 13 52-61 7 20 61-70 6 26 70-79 3 29 79-88 2 31 88-97 1 32 xi fi fixi 10 17 170 30 f1 30f1 50 32 1600 70 f2 70f2 90 19 1710 N = 120 = 3480 + 30f1 + 70f2 Given, Mean = 50
= 50
= 50
30f1 + 70f2 + 3480 = 6000
30f1 + 70f2 = 6000 - 3480
30f1 + 70f2 = 2520
3f1 + 7f2 = 252 ....(i) [Divide by 10]
And N = 120
17 + f1 + 32 + f2 + 19 = 120
68 + f1 + f2 = 120
f1 + f2 = 120 - 68 = 52
3f1 + 3f2 = 156 ...(ii) [Multiply by 3]
Subtract equation (ii) from equation (i),
3f1 + 7f2 - 3f1 - 3f2 = 252 - 156
4f2 = 96
f2 = = 24
Put value of f2 in equation (i),
3f1 + 7 24 = 252
3f1 + 168 = 252
3f1 = 252 - 168 = 84
f1 = = 28