Measures of Central Tendency - Revision Notes
CBSE Class 11 Economics
Revision Notes
Chapter - 5
MEASURES OF CENTRAL TENDENCY
Points to Remember: A central tendency is a single figure that represents the whole mass of data
Arithmetic mean or mean is the number which is obtained by adding the values of all the items of a series and dividing the total by the number of items.
When all items of a series are given equal importance than it is called simple arithmetic mean and when different items of a series are given different weights according with their relative importance is known weighted arithmetic mean.
Median is the middle value of the series when arranged in order of the magnitude.
When a series is divided into more than two parts, the dividing values are called Partition values.
Quartiles are the measures which divide the data into four equal parts, each portion contains equal number of observation,
There are three quartiles
If a statistical series is divided into four equal parts, the end value of each part is called a quartile and denoted by ‘Q’.
The lower half of a data set is the set of all values that are to the left of the median value when the data has been put into increasing order.
The upper half of a data set is the set of all values that are to the right of the median value when the data has been put into increasing order.
The first quartile, denoted by Q1 , is the median of the lower half of the data set. This means that about 25% of the numbers in the data set lie below Q1 and about 75% lie above Q1 .
The second quartile also called median and denoted by Q2, has 50% of the items below it and 50% of the items above it.
The third quartile, denoted by Q3 , is the median of the upper half of the data set. This means that about 75% of the numbers in the data set lie below Q3 and about 25% lie above Q3 .
Deciles distribute the series into ten equal parts and generally expressed as D.
Percentiles divide the series into hundred equal parts and generally expressed as P.
Mode is the value which occurs most frequently in the series, that modal value has the highest frequency in the series.
Main purposes and functions of averages.
(i) To represent a brief picture of data.
(ii) Comparison.
(iii) Formulation of policies.
(iv) Basis of statistical analysis.
(v) One value for all the group or series.
Essentials of a good average.
(i) Easy to understand.
(ii) Easy to compute
(iii) Rigidly defined.
(iv) Based on all the items of series.
(v) Certain in character
(vi) Least effect of a change in the sample.
(vii) Capable of algebraic treatment.
Merits of Arithmetic mean:
(i) Simplicity
(ii) Certainty
(iii) Based on all values.
(iv) Algebraic treatment possible.
(v) Basis of comparison
(vi) Accuracy test possible.
(vii) No scope for estimated value.
Demerits of Arithmetic mean:
(i) Effect of extreme values.
(ii) Mean value may not figure in the series.
(iii) unsuitability.
(iv) Misleading conclusions.
(v) Can not be used in case of qualitative phenomenon.
(vi) Gets distorted by extreme value of the series.
Merits of Median:
(i) Simple measure of central tendency.
(ii) It is not affected by extreme observations.
(iii) Possible even when data is incomplete.
(iv) Median can be determined by graphic presentation of data.
(v) It has a definite value.
(vi) Simple to calculate and understand
(vii) It is a positional value not a calculated value.
Demerits of median:
(i) Not based on all the items in the series, as it indicates the value of middle items.
(ii) Not suitable for algebraic treatment.
(iii) Arranging the data in ascending order takes much time.
(iv) Affected by fluctuations of items.
(v) It cannot be computed exactly where the number of items in a series is even.
Merits of mode:
(i) Simple and popular measure of central tendency.
(ii) It can be located graphically with the help of histogram.
(iii) Less effect of marginal values.
(iv) No need of knowing all the items of series.
(v) It is the most representative value in the given series.
(vi) It is less effected by extreme values.
Demerits of mode:
(i) It is an uncertain measure.
(ii) It is not capable of algebraic treatment.
(iii) Procedure of grouping is complex.
(iv) It is not based on all observations.
(v) For bi- modal and tri-modal series, it is difficult to calculate.
(vi) Its value is not based on each and every item of the series.
(vii) If items are identical, it is difficult to identify the modal value.
Relation among mean, median and mode :
Mode = 3 median - 2 mean
Location of median by graph:
(i) By ‘Less than’ or ‘More than’ ogives method a frequency distribution series is first converted into a less than or more than cumulative series as in the case of ogives, data are presented graphically to make a ‘less than’ or ‘more than’ ogive, N/2 item of the series is determined and from this point (on the y-axis of the graph) a perpendicular is drawn to the right to cut the cumulative frequency curve. The median value is the one where cumulative frequency curve cuts corresponding to x-axis.
(ii) Less than and more than ogive curve method present the data graphically in the form of ‘less than’ and ‘more than’ ogives simultaneously. The two ogives are superimposed upon each other to determine the median value. Mark the point where the ogive curve cut each other, draw a perpendicular from that point on x-axis, the corresponding value on the x-axis would be the median value.
Graphic presentation of mode:
Prepare a histogram from the given data. Find out the rectangle whose height is the highest. This will be the modal class. Draw two lines-one joining the top right point of the rectangle preceding the modal class with top right point of the modal class. The other joining the top left point of the modal class with the top left point of the post modal class. From the point of intersection of these two diagonal lines, draw a perpendicular on horizontal axis i.e., x-axis the point where this perpendicular line meets x-axis, gives us the value of mode.
Formulae of calculating arithmetic mean:
Types of Series | Direct Method | Shortcut Methods | Step deviation Methods |
Individual Series |
|
|
|
Discrete series |
|
|
|
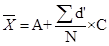
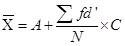
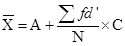
Continuous Series |
|
|
|


Combines Mean 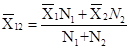
Weighted Mean 
Formulae of calculating median and partition values:
Measure | Individual Series | Discrete Series | Continuous Series | |
Size of item | Size of item | Size of item | Size of item | Formula |
Median |
|
|
|
|
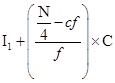
First Quartile |
|
|
|
|
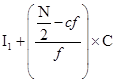
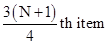
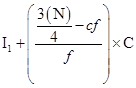
Third Quartile |
|
|
|
|


Formula of calculating mode in continuous series:
Mode = 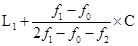
Where,  = Lower limit of modal class
 = Frequency of the group preceding the modal class
 = Frequency of the modal class
 = Frequency of the group succeeding the modal class
 = Magnitude or class interval of the modal class