Introduction to Graphs - Worksheets
CBSE Worksheet 01
Class 08 - Mathematics (Introduction to Graphs)
Class 08 - Mathematics (Introduction to Graphs)
General Instructions: All questions are compulsory. Q.1 to Q.2 carries one mark each. Q.3 to Q.7 carries two marks each. Q.8 and Q.9 carries three marks each. Q.10 to Q.12 carries four marks each.
- What is the name of the Vertical line used to draw line graph?
- What are coordinates of a points?
- State True/false
- The point of intersection of X-axis and Y-axis is called origin.
- In the point (0,3), the value of Y-axis is 3.
- The value of X-axis in point (9,3) is 3.
- The Distance of point (2,3) from X-axis is 2.
- Fill up the blanks:
- Point (0, 4) lies on the ______ axis.
- Point (5, 0) lies on the _______ axis.
- On joining points (0, 0), (0, 2), (2, 2) and (2, 0) we obtain a _______.
- Point (2, –3) lies in the _______ quadrant.
- Match the columns:
Column A Column B i. Graph for grouped dataa. (– x, y)ii. Graph to represent parts of a wholeb. Linear graphiii. A straight unbroken linec. Pie Chart or pie graphiv. Coordinates of a point in Quadrant IId. Histogram - Factorise.4p2 – 9q2
- Find and correct the errors in the following mathematical statement. Substituting x = – 3 in the given equation (a – 4) (a – 2) = a2 – 8
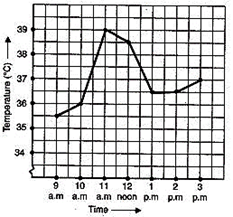
- The following graph shows the temperature of a patient in a hospital, recorded every hour.
- What was the patient's temperature at 1 p.m.?
- When was the patient's temperature 38.5°C?
- The patient's temperature was the same two times during the period given. What were these two times?
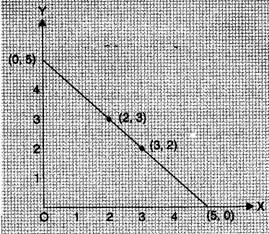
- Draw the line passing through (2, 3) and (3, 2). Find the coordinates of the points at which this line meets the x-axis and y-axis.
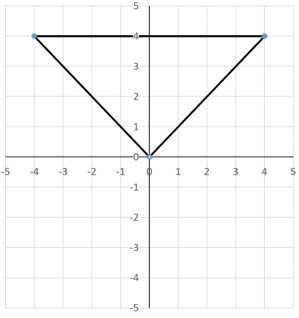
- Plot the points A (4, 4) and B (–4, 4) on a graph sheet. Join the lines OA, OB and BA. What figure do you obtain?
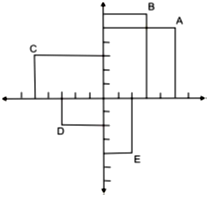
- Observe the figure given and find answer the questions:
- What are the coordinates of point B
- Which point has coordinates (2,-3)
- What are the coordinates of point D?
- Which points lie in first quadrant?
- Consider the relation between the area and the side of a square, given by A = x2.
- Draw a graph to show this relation.
- From the graph, find the value of A when x = 4.
- Is this graph a linear graph?
Side of square (x)012345Area of square (A)01491625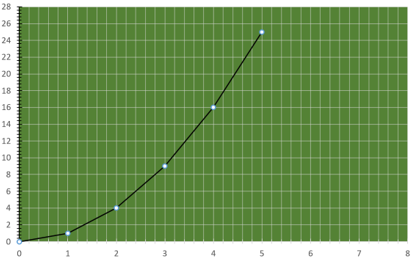
CBSE Worksheet 01
Class 08 - Mathematics (Introduction to Graphs)
Solution
Class 08 - Mathematics (Introduction to Graphs)
Solution
- y - axis
- The values of X-axis and Y-axis that show the position of a point are called its coordinates.
- True
- True
- False , the value of x -axis in point (9,3) is 9.
- False , the distance of point (2,3) from x-axis is 3 units.
- Y-axis
- X-axis
- Square
- Fourth
- - d
- - c
- - b
- - a
- 4p2 – 9q2
= (2p)2 – (3q)2
= (2p – 3q) (2p + 3q). . . . [Using Identity III - (a – 4) (a – 2) = a (a – 2) – 4 (a – 2)
= a2 – 2a – 4a + 8
= a2 – 6a + 8 - The patient's temperature at 1 p.m. was 36.5°C.
- The patient's temperature was 38.5°C at 12 noon.
- The two times when the patient's temperature was the same were 1 p.m. and 2 p.m. (36.5°C)
- The coordinates of the points at which this line meets the x-axis and y-axis are (5, 0) and (0, 5) respectively.
- O means (0,0). So, The figure obtained is an Isosceles triangle.
- (3,6)
- Point E
- (-3, -2)
- Points A & B
- The graph is drawn.
- From the graph it is clear that area when x = 4 is 16.
- This graph is not a linear graph.