Data Handling-Solutions Ex-9.2
CBSE Class –VI Mathematics
NCERT Solutions
Chaper 9 Data handling (Ex. 9.2)
NCERT Solutions
Chaper 9 Data handling (Ex. 9.2)
Question 1. Total number of animals in five villages are as follows:
Village A: 80
Village B: 120
Village C: 90
Village D: 40
Village E: 60
Prepare a pictograph of these animals using one symbol to represent 10 animals and answer the following questions:
(a) How many symbols represent animals of village E?
(b) Which village has the maximum number of animals?
(c) Which village has more animals: village A or village C?
Answer:
= 10 animals | ||
Village A Village B Village C Village D Village E | 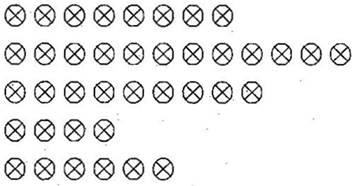 | 80 120 90 40 60 |
(a) 6
(b) Village B
(c) Village C has more animals than Village A
Question 2.Total number of students of a school in different years is shown in the following table:
Years | Number of students |
1996 | 400 |
1998 | 535 |
2000 | 472 |
2002 | 600 |
2004 | 623 |
A. Prepare a pictograph of students using one symbol  to represent 100 students and answer the following questions:
to represent 100 students and answer the following questions:(a) How many symbols represent total number of students in the year 2002?
(b) How many symbols represent total number of students for the year 1998?
B. Prepare another pictograph of students using any other symbol each representing 50 students. Which pictograph do you find more informative?
Answer: A.
Years | = 100 students  |
1996 1998 2000 2002 2004 | 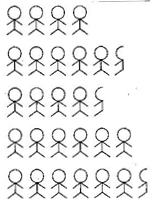 |
(a) 6
(b) Five completed and one incompleted.
B.
Years |  = 50 students = 50 students |
1996 1998 2000 2002 2004 | 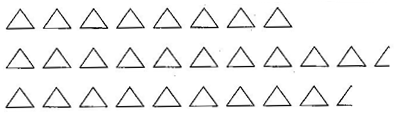 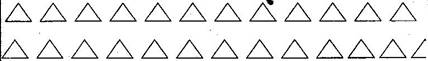 |
Pictograph A is more informative and appropriate than B.