Correlation - Revision Notes
CBSE Class 11 Economics
Revision Notes
Chapter - 7
CORRELATION
Points to remember
Meaning of correlation: Correlation is a statistical tool which studies the relationship between two variables e.g. change in price leads to change in quantity demanded.
Correlation studies and measures the direction and intensity of relationship among variables. It measures co-variation not causation. It does not imply cause and effect relation.
Type of Correlation
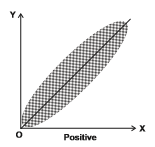
Correlation is classified into positive and negative correlation. The correlation is said to be positive when the variables move together in the same direction. e.g. sale of lce cream and temperature move in same direction.
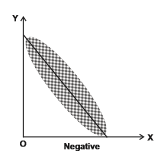
The correlation is said to be negative when the variables move in opposite direction. e.g. When you spend more time in studying chances of your failure decline.
Examples of positive correlation are:
1. Price and supply of a commodity.
2. Increase in Height and Weight.
3. Age of husband and age of wife.
4. The family income and expenditure on luxury items.
Examples of negative correlation are:
1. Sale of woollen garments and day temperature.
2. Price and Demand of a commodity.
3. Yield of crops and price.
Degree of Correlation:
| Degree | Positive | Negative |
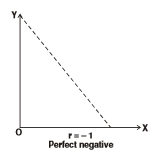
| Perfect | +1 | -1 |
| High | Between +0.75 and +1 | Between -0.75 and -1 |
| Moderate | Between +0.25 and +0.75 | Between -0.25 and -0.75 |
| Low | Between 0 and +0.25 | Between 0 and -0.25 |
| Zero | 0 | 0 |
Methods of estimating correlation:
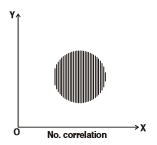
(a) Scatter diagram
(b) Karl person’s coefficient of correlation.
(c) Spearman’s rank correlation.
Scatter diagram offers a graphic expression of the direction and degree of correlation. To construct a scatter diagram, x variables taken on X-axis and y variable is taken on Y-axis. The cluster of points, plotted is referred to as a scatter diagram. In this, the degree of closeness of scatter points and their overall direction enables us to examine the relationship.
Karl person’s coefficient of correlation is a quantitative method of calculating correlation. It gives a precise numerical value of the degree of linear relationship between two variables.
Karl person’s coefficient of correlation is also known as product moment correlation.
Formula: 
Here,
r = Coefficient of correlation
 = Standard deviation of X-series.
 = Standard deviation of Y-series.
N = Number of observations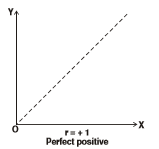
Karl Person’s coefficient of correlation is calculated by following methods:
(a) Actual mean method: 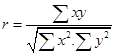
Here,
r = Coeff. Of correlation
(b) Assumed Mean method: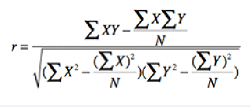
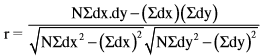
Here,
dx = Deviations of x-series from assumed mean = (X - A)
dy = Deviation of Y-series from assumed mean = (Y - A) = Sum of multiple of dx and dy.
 = Sum of the square of dx.
 = Sum of the square of dy
 = Sum of the deviation of x-series
 = Sum of the deviation of Y-series
N = Number of pairs of observations
When value of the variables are large, we use step deviation method to reduce the burden of calculation.
(c) Step deviation method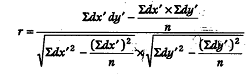
Here, 

dx = deviation of X-series from assumed mean = (X-A)
dy = deviation of Y-series from assumed mean = (Y-A) = Sum of multiple of dx and dy. = Sum of the square of dx. = Sum of the square of dy = Sum of the deviation of x-series = Sum of the deviation of Y-series
N = Number of pairs of observations
C1 is common factor for series -x
C2 is common factor for series -y
Properties of correlation coefficient(r)
(i) Correlation coefficient (r) has no unit.
(ii) A negative value of r indicates an inverse relation.
(iii) If r is positive then two variables move in the same direction.
(iv) The value of r lies between minus – 1 and +1, i.e. 
(v) If r is zero, the two variables are uncorrelated.
(vi) If r = + 1 or r = – 1, the correlation is perfect.
(vii) A high value of r indicates strong linear relationship and a low value or indicates a weak linear relationship.
(viii) The value of r is unaffected by the change of origin and change of scale.
Given two variables x and y let us define two new variables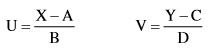
Here A and C are assumed means of X and V respectively. B and D are common factors. They rxy = ruv.
Spearman’s rank correlation method is used to calculate coefficient of correlation of qualitative variables such as beauty, bravery, wisdom, ability virtue etc. It was developed by British Psychologist C.E. spearman.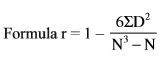
Here,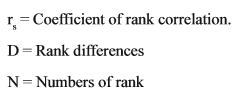
When ranks are repeated the formula is: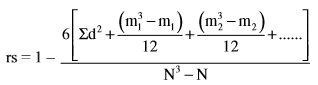
Where  are number of repetitions of ranks.